This the multi-page printable view of this section. Click here to print.
FAQ
- 1: Authentication
- 2: Distributed Tracing
- 3: General
- 4: Graph
- 5: Installation
- 6: Istio Component Status
- 7: Validations
1 - Authentication
How to obtain a token when logging in via token auth strategy
When configuring Kiali to use the token auth strategy, it requires users to log into Kiali as a specific user via the user’s service account token. Thus, in order to log into Kiali you must provide a valid Kubernetes token.
You can extract a service account’s token from the secret that was created for you when you created the service account.
For example, if you want to log into Kiali using Kiali’s own service account, you can get the token like this:
kubectl get secret -n istio-system $(kubectl get sa kiali-service-account -n istio-system -o jsonpath={.secrets[0].name}) -o jsonpath={.data.token} | base64 -d
Note that this example assumes you installed Kiali in the istio-system namespace.
Once you obtain the token, you can go to the Kiali login page and copy-and-paste that token into the token field. At this point, you have logged into Kiali with the same permissions as that of the Kiali server itself (note: this gives the user the permission to see everything).
Create different service accounts with different permissions for your users to use. Each user should only have access to their own service accounts and tokens.
How to configure the originating port when Kiali is served behind a proxy (OpenID support)
When using OpenID strategy for authentication and deploying Kiali behind a reverse proxy or a load balancer, Kiali needs to know the originating port of client requests. You may need to setup your proxy to inject a X-Forwarded-Port HTTP header when forwarding the request to Kiali.
For example, when using an Istio Gateway and VirtualService to expose Kiali, you could use the headers property of the route:
spec:
  gateways:
  - istio-ingressgateway.istio-system.svc.cluster.local
  hosts:
  - kiali.abccorp.net
  http:
  - headers:
      request:
        set:
          X-Forwarded-Port: "443"
    route:
    - destination:
        host: kiali
        port:
          number: 20001
2 - Distributed Tracing
Why is Jaeger unreachable or Kiali showing the error “Could not fetch traces”?
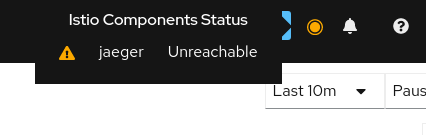
Istio components status indicator shows “Jaeger unreachable”:
While on any Tracing page, error “Could not fetch traces” is displayed:
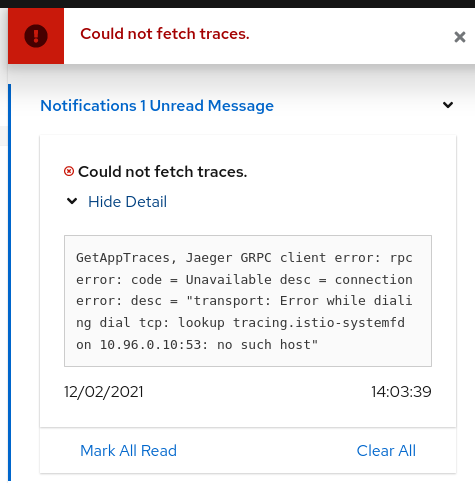
Apparently, Kiali is unable to connect to Jaeger. Make sure tracing is correctly configured in the Kiali CR.
      tracing:
        auth:
          type: none
        enabled: true
        in_cluster_url: 'http://tracing.istio-system/jaeger'
        url: 'http://jaeger.example.com/'
        use_grpc: true
You need especially to pay attention to the in_cluster_url field, which is how Kiali backend contacts the Jaeger service. In general, this URL is written using Kubernetes domain names in the form of http://service.namespace, plus a path.
If you’re not sure about this URL, try to find your Jaeger service and its exposed ports:
$ kubectl get services -n istio-system
...
tracing      ClusterIP      10.108.216.102   <none>        80/TCP      47m
...
To validate this URL, you can try to curl its API via Kiali pod, by appending /api/traces to the configured URL (in the following, replace with the appropriate Kiali pod):
$ kubectl exec -n istio-system -it kiali-556fdb8ff5-p6l2n -- curl http://tracing.istio-system/jaeger/api/traces

{"data":null,"total":0,"limit":0,"offset":0,"errors":[{"code":400,"msg":"parameter 'service' is required"}]}
If you see some returning JSON as in the above example, that should be the URL that you must configure.
If instead of that you see some blocks of mixed HTML/Javascript mentioning JaegerUI, then probably the host+port are correct but the path isn’t.
A common mistake is to forget the /jaeger suffix, which is often used in Jaeger deployments.
It may also happen that you have a service named jaeger-query, exposing port 16686, instead of the more common tracing service on port 80. In that situation, set in_cluster_url to http://jaeger-query.istio-system:16686/jaeger.
If Jaeger needs an authentication, make sure to correctly configure the auth section.
Note that in general, Kiali will connect to Jaeger via GRPC, which provides better performances. If for some reason it cannot be done (e.g. Jaeger being behind a reverse-proxy that doesn’t support GRPC, or that needs more configuration in that purpose), it is possible to switch back to using the http/json API of Jaeger by setting use_grpc to false.
If for some reason the GRPC connection fails and you think it shouldn’t (e.g. your reverse-proxy supports it, and the non-grpc config works fine), please get in touch with us.
Why can’t I see any external link to Jaeger?
In addition to the embedded integration that Kiali provides with Jaeger, it is possible to show external links to the Jaeger UI. To do so, the external URL must be configured in the Kiali CR.
    tracing:
      # ...
      url: "http://jaeger.example.com/"
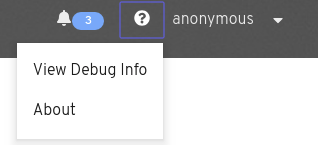
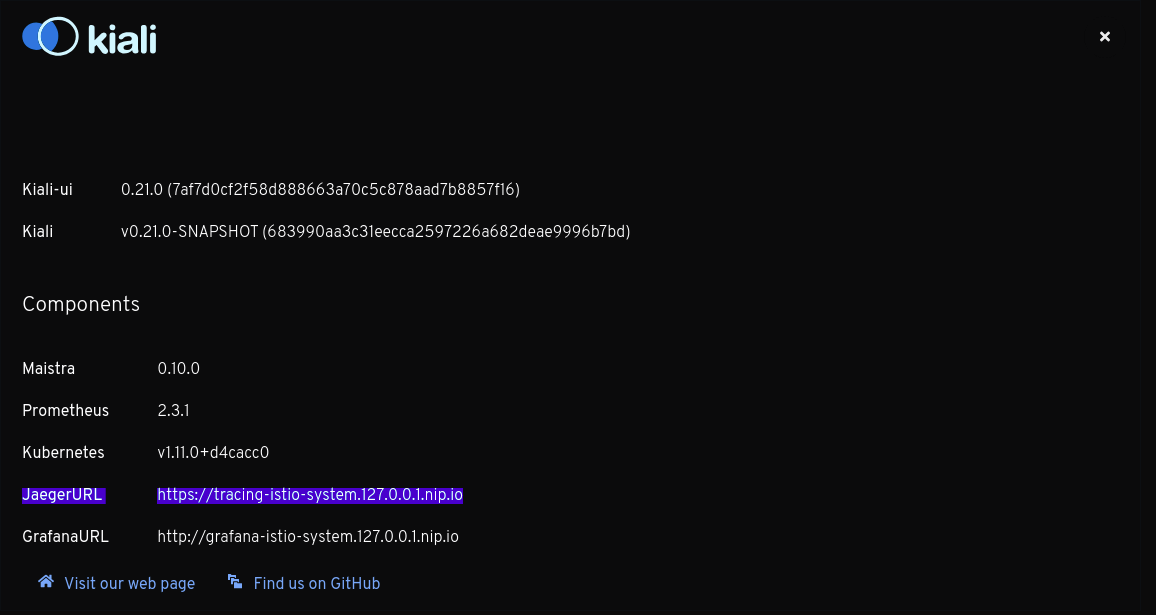
When configured, this URL will be used to generate a couple of links to Jaeger within Kiali. It’s also visible in the About modal:
Why do I see an external link instead of Kiali’s own Tracing page?
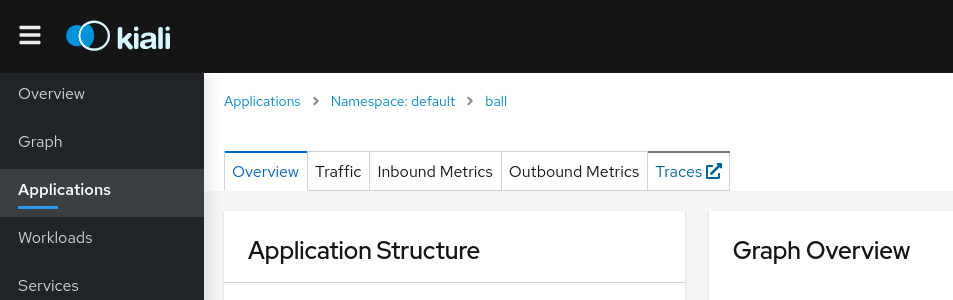
On the Application detail page, the Traces tab might redirect to Jaeger via an external link instead of showing the Kiali Tracing view. It happens when you have the url field configured, but not in_cluster_url, which means the Kiali backend will not be able to connect to Jaeger.
To fix it, configure in_cluster_url in Kiali CR.
Why do I see “Missing root span” for the root span of some span details on Traces tab?
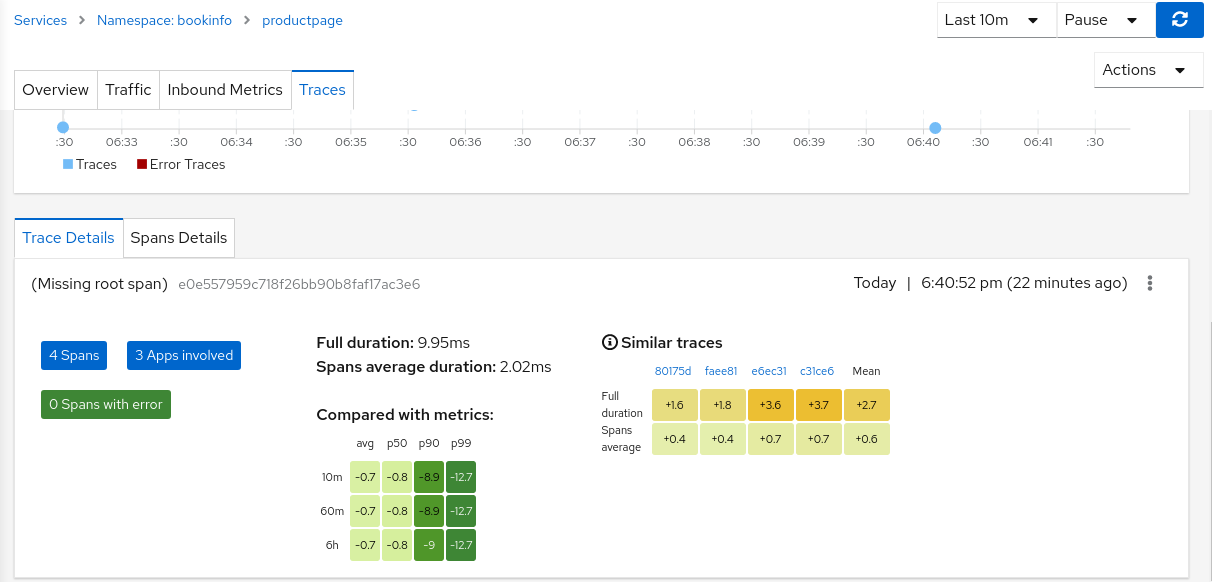
In Traces tab, while clicking on a trace, it shows the details of that trace and information about spans. These details also include the root span information. But for the traces for traffic that is not comming from ingress-gateway, the root span information is not available in Jaeger, thus Kiali is displaying “Missing root span” for those traces' details and tooltips in Traces tab and in Graph pages.
3 - General
Why is the Workload or Application Detail page so slow or not responding?
We have identified a performance issue that happens while visiting the Workload or Application detail page, related to discovering metrics in order to show custom dashboards. Both Kiali and Prometheus may run out of memory.
The immediate workaround is to disable dashboards discovery:
spec:
  external_services:
    custom_dashboards:
      discovery_enabled: "false"
It’s also recommended to consider a more robust setup for Prometheus, like the one described in this Istio guide (see also this Kiali blog post), in order to decrease the metrics cardinality.
What do I need to run Kiali in a private cluster?
Private clusters have higher network restrictions. Kiali needs your cluster to allow TCP traffic between the Kubernetes API service and the Istio Control Plane namespace, for both the 8080 and 15000 ports. This is required for features such as Health and Envoy Dump to work as expected.
Make sure that the firewalls in your cluster allow the connections mentioned above.
Check section Google Kubernetes Engine (GKE) Private Cluster requirements in the Installation Guide.
Does Kiali support Internet Explorer?
No version of Internet Explorer is supported with Kiali. Users may experience some issues when using Kiali through this browser.
Kiali does not work - What do i do?
If you are hitting a problem, whether it is listed here or not, do not hesitate to open a GitHub Discussion to ask about your situation. If you are hitting a bug, or need a feature, you can vote (using emojis) for any existing bug or feature request found in the GitHub Issues. This will help us prioritize the most needed fixes or enhancements. You can also create a new issue.
See also the Community page which lists more contact channels.
How do I obtain the logs for Kiali?
Kiali operator logs can be obtained from within the Kiali operator pod. For example, if the operator is installed in the kiali-operator namespace:
KIALI_OPERATOR_NAMESPACE="kiali-operator"
kubectl logs -n ${KIALI_OPERATOR_NAMESPACE} $(kubectl get pod -l app=kiali-operator -n ${KIALI_OPERATOR_NAMESPACE} -o name)
Kiali server logs can be obtained from within the Kiali server pod. For example, if the Kiali server is installed in the istio-system namespace:
KIALI_SERVER_NAMESPACE="istio-system"
kubectl logs -n ${KIALI_SERVER_NAMESPACE} $(kubectl get pod -l app=kiali -n ${KIALI_SERVER_NAMESPACE} -o name)
Note that you can configure the logger in the Kiali Server.
Which Istio metrics and attributes are required by Kiali?
To reduce Prometheus storage some users want to customize the metrics generated by Istio. This can break Kiali if the pruned metrics and/or attributes are used by Kiali in its graph or metric features.
Kiali currently requires the following metrics and attributes (note, this assumes Telemetry V2 in being used):
| Metric | Notes |
|---|---|
| istio_requests_total | used throughout Kiali and the primary metric for http/grpc traffic graph generation |
| istio_request_bytes_sum | used in metrics displays |
| istio_request_duration_milliseconds_bucket | used throughout Kiali for response time calculation. used by iter8 extension. |
| istio_request_duration_milliseconds_sum | used throughout Kiali for response time calculation. used by iter8 extension. |
| istio_response_bytes_sum | used in metrics displays |
| istio_tcp_received_bytes_total | used in metrics displays |
| istio_tcp_sent_bytes_total | used throughout Kiali and the primary metric for tcp traffic graph generation |
| Attribute | Metric | Notes |
|---|---|---|
| connection_security_policy | istio_requests_total | used only when graph Security display option is enabled |
| destination_canonical_revision | istio_requests_total | |
| istio_request_duration_milliseconds_bucket | ||
| istio_request_duration_milliseconds_sum | ||
| istio_tcp_sent_bytes_total | ||
| destination_canonical_service | istio_requests_total | |
| istio_request_bytes_sum | ||
| istio_request_duration_milliseconds_bucket | ||
| istio_request_duration_milliseconds_sum | ||
| istio_response_bytes_sum | ||
| istio_tcp_received_bytes_total | ||
| istio_tcp_sent_bytes_total | ||
| destination_principal | istio_requests_total | used only when graph Security display option is enabled |
| istio_tcp_sent_bytes_total | ||
| destination_service | istio_requests_total | |
| istio_request_duration_milliseconds_bucket | ||
| istio_request_duration_milliseconds_sum | ||
| istio_tcp_sent_bytes_total | ||
| destination_service_name | istio_requests_total | |
| istio_request_bytes_sum | ||
| istio_request_duration_milliseconds_bucket | ||
| istio_request_duration_milliseconds_sum | ||
| istio_response_bytes_sum | ||
| istio_tcp_received_bytes_total | ||
| istio_tcp_sent_bytes_total | ||
| destination_service_namespace | istio_requests_total | |
| istio_request_bytes_sum | ||
| istio_request_duration_milliseconds_bucket | ||
| istio_request_duration_milliseconds_sum | ||
| istio_response_bytes_sum | ||
| istio_tcp_received_bytes_total | ||
| istio_tcp_sent_bytes_total | ||
| destination_workload | istio_requests_total | |
| istio_request_bytes_sum | ||
| istio_request_duration_milliseconds_bucket | ||
| istio_request_duration_milliseconds_sum | ||
| istio_response_bytes_sum | ||
| istio_tcp_received_bytes_total | ||
| istio_tcp_sent_bytes_total | ||
| destination_workload_namespace | istio_requests_total | |
| istio_request_bytes_sum | ||
| istio_request_duration_milliseconds_bucket | ||
| istio_request_duration_milliseconds_sum | ||
| istio_response_bytes_sum | ||
| istio_tcp_received_bytes_total | ||
| istio_tcp_sent_bytes_total | ||
| grpc_response_status | istio_requests_total | used only when request_protocol=“grpc” |
| istio_request_bytes_sum | ||
| istio_request_duration_milliseconds_bucket | ||
| istio_request_duration_milliseconds_sum | ||
| istio_response_bytes_sum | ||
| istio_tcp_received_bytes_total | ||
| istio_tcp_sent_bytes_total | ||
| job | istio_request_duration_milliseconds_sum | used only by iter8 extension |
| reporter | istio_requests_total | both “source” and “destination” metrics are used by Kiali |
| istio_request_bytes_sum | ||
| istio_request_duration_milliseconds_bucket | ||
| istio_request_duration_milliseconds_sum | ||
| istio_response_bytes_sum | ||
| istio_tcp_received_bytes_total | ||
| istio_tcp_sent_bytes_total | ||
| request_operation | istio_requests_total | used only when request classification is configured. “request_operation” is the default attribute, it is configurable. |
| istio_request_bytes_sum | ||
| istio_response_bytes_sum | ||
| request_protocol | istio_requests_total | |
| istio_request_bytes_sum | ||
| istio_response_bytes_sum | ||
| response_code | istio_requests_total | |
| istio_request_bytes_sum | ||
| istio_request_duration_milliseconds_bucket | ||
| istio_request_duration_milliseconds_sum | ||
| istio_response_bytes_sum | ||
| response_flags | istio_requests_total | |
| istio_request_bytes_sum | ||
| istio_request_duration_milliseconds_bucket | ||
| istio_request_duration_milliseconds_sum | ||
| istio_response_bytes_sum | ||
| source_canonical_revision | istio_requests_total | |
| istio_request_duration_milliseconds_bucket | ||
| istio_request_duration_milliseconds_sum | ||
| istio_tcp_sent_bytes_total | ||
| source_canonical_service | istio_requests_total | |
| istio_request_bytes_sum | ||
| istio_request_duration_milliseconds_bucket | ||
| istio_request_duration_milliseconds_sum | ||
| istio_response_bytes_sum | ||
| istio_tcp_received_bytes_total | ||
| istio_tcp_sent_bytes_total | ||
| source_principal | istio_requests_total | |
| istio_tcp_sent_bytes_total | ||
| source_workload | istio_requests_total | |
| istio_request_bytes_sum | ||
| istio_request_duration_milliseconds_bucket | ||
| istio_request_duration_milliseconds_sum | ||
| istio_response_bytes_sum | ||
| istio_tcp_received_bytes_total | ||
| istio_tcp_sent_bytes_total | ||
| source_workload_namespace | istio_requests_total | |
| istio_request_bytes_sum | ||
| istio_request_duration_milliseconds_bucket | ||
| istio_request_duration_milliseconds_sum | ||
| istio_response_bytes_sum | ||
| istio_tcp_received_bytes_total | ||
| istio_tcp_sent_bytes_total |
What is the License?
See here for the Kiali license.
Why isn’t my namespace in the Namespace Selection dropdown?
When deploying Kiali with the Kiali operator, by default some namespaces are excluded from the list of namespaces provided by the API and UI. Kiali filters out these namespaces and you will not see them in the Namespace Selection dropdown. You can adjust which namespaces are excluded by setting the spec.api.namespaces.exclude field on the Kiali CR.
In addition, you must ensure that Kiali has access to the namespaces you are interested in by setting the spec.deployment.accessible_namespaces field on the Kiali CR accordingly. Setting spec.api.namespaces.exclude alone does not give Kiali access to the namespaces. See the Namespace Management guide for more information.
Kiali also caches namespaces by default for 10 seconds. If the cache is enabled, it might take up to the spec.kubernetes_config.cache_token_namespace_duration in order for a newly added namespace to be seen by Kiali.
Workload “is not found as” messages
Kiali queries Deployment ,ReplicaSet, ReplicationController, DeploymentConfig, StatefulSet, Job and CronJob controllers. Deployment, ReplicaSet and StatefulSet are always queried, but ReplicationController, DeploymentConfig, Job and CronJobs are excluded by default for performance reasons.
To include them, update the list of excluded_workloads from the Kiali config.
#    ---
#    excluded_workloads:
#    - "CronJob"
#    - "DeploymentConfig"
#    - "Job"
#    - "ReplicationController"
#
An empty list will tell Kiali to query all type of known controllers.
Why Health is not available for services using TCP protocol?
Health for Services is calculated based on success rate of traffic. The traffic of HTTP and GRPC protocols is request based and it is possible to inspect each request to check and extract response codes to determine how many requests succeeded and how many erred.
However, HTTP is a widely known protocol. Applications may use other less known protocols to communicate. For these cases, Istio logs the traffic as raw TCP (an opaque sequence of bytes) and is not analyzed. Thus, for Kiali it is not possible to know if any traffic have failed or succeeded and reports Health as unavailable.
4 - Graph
Why are my TCP requests disconnected in the graph?
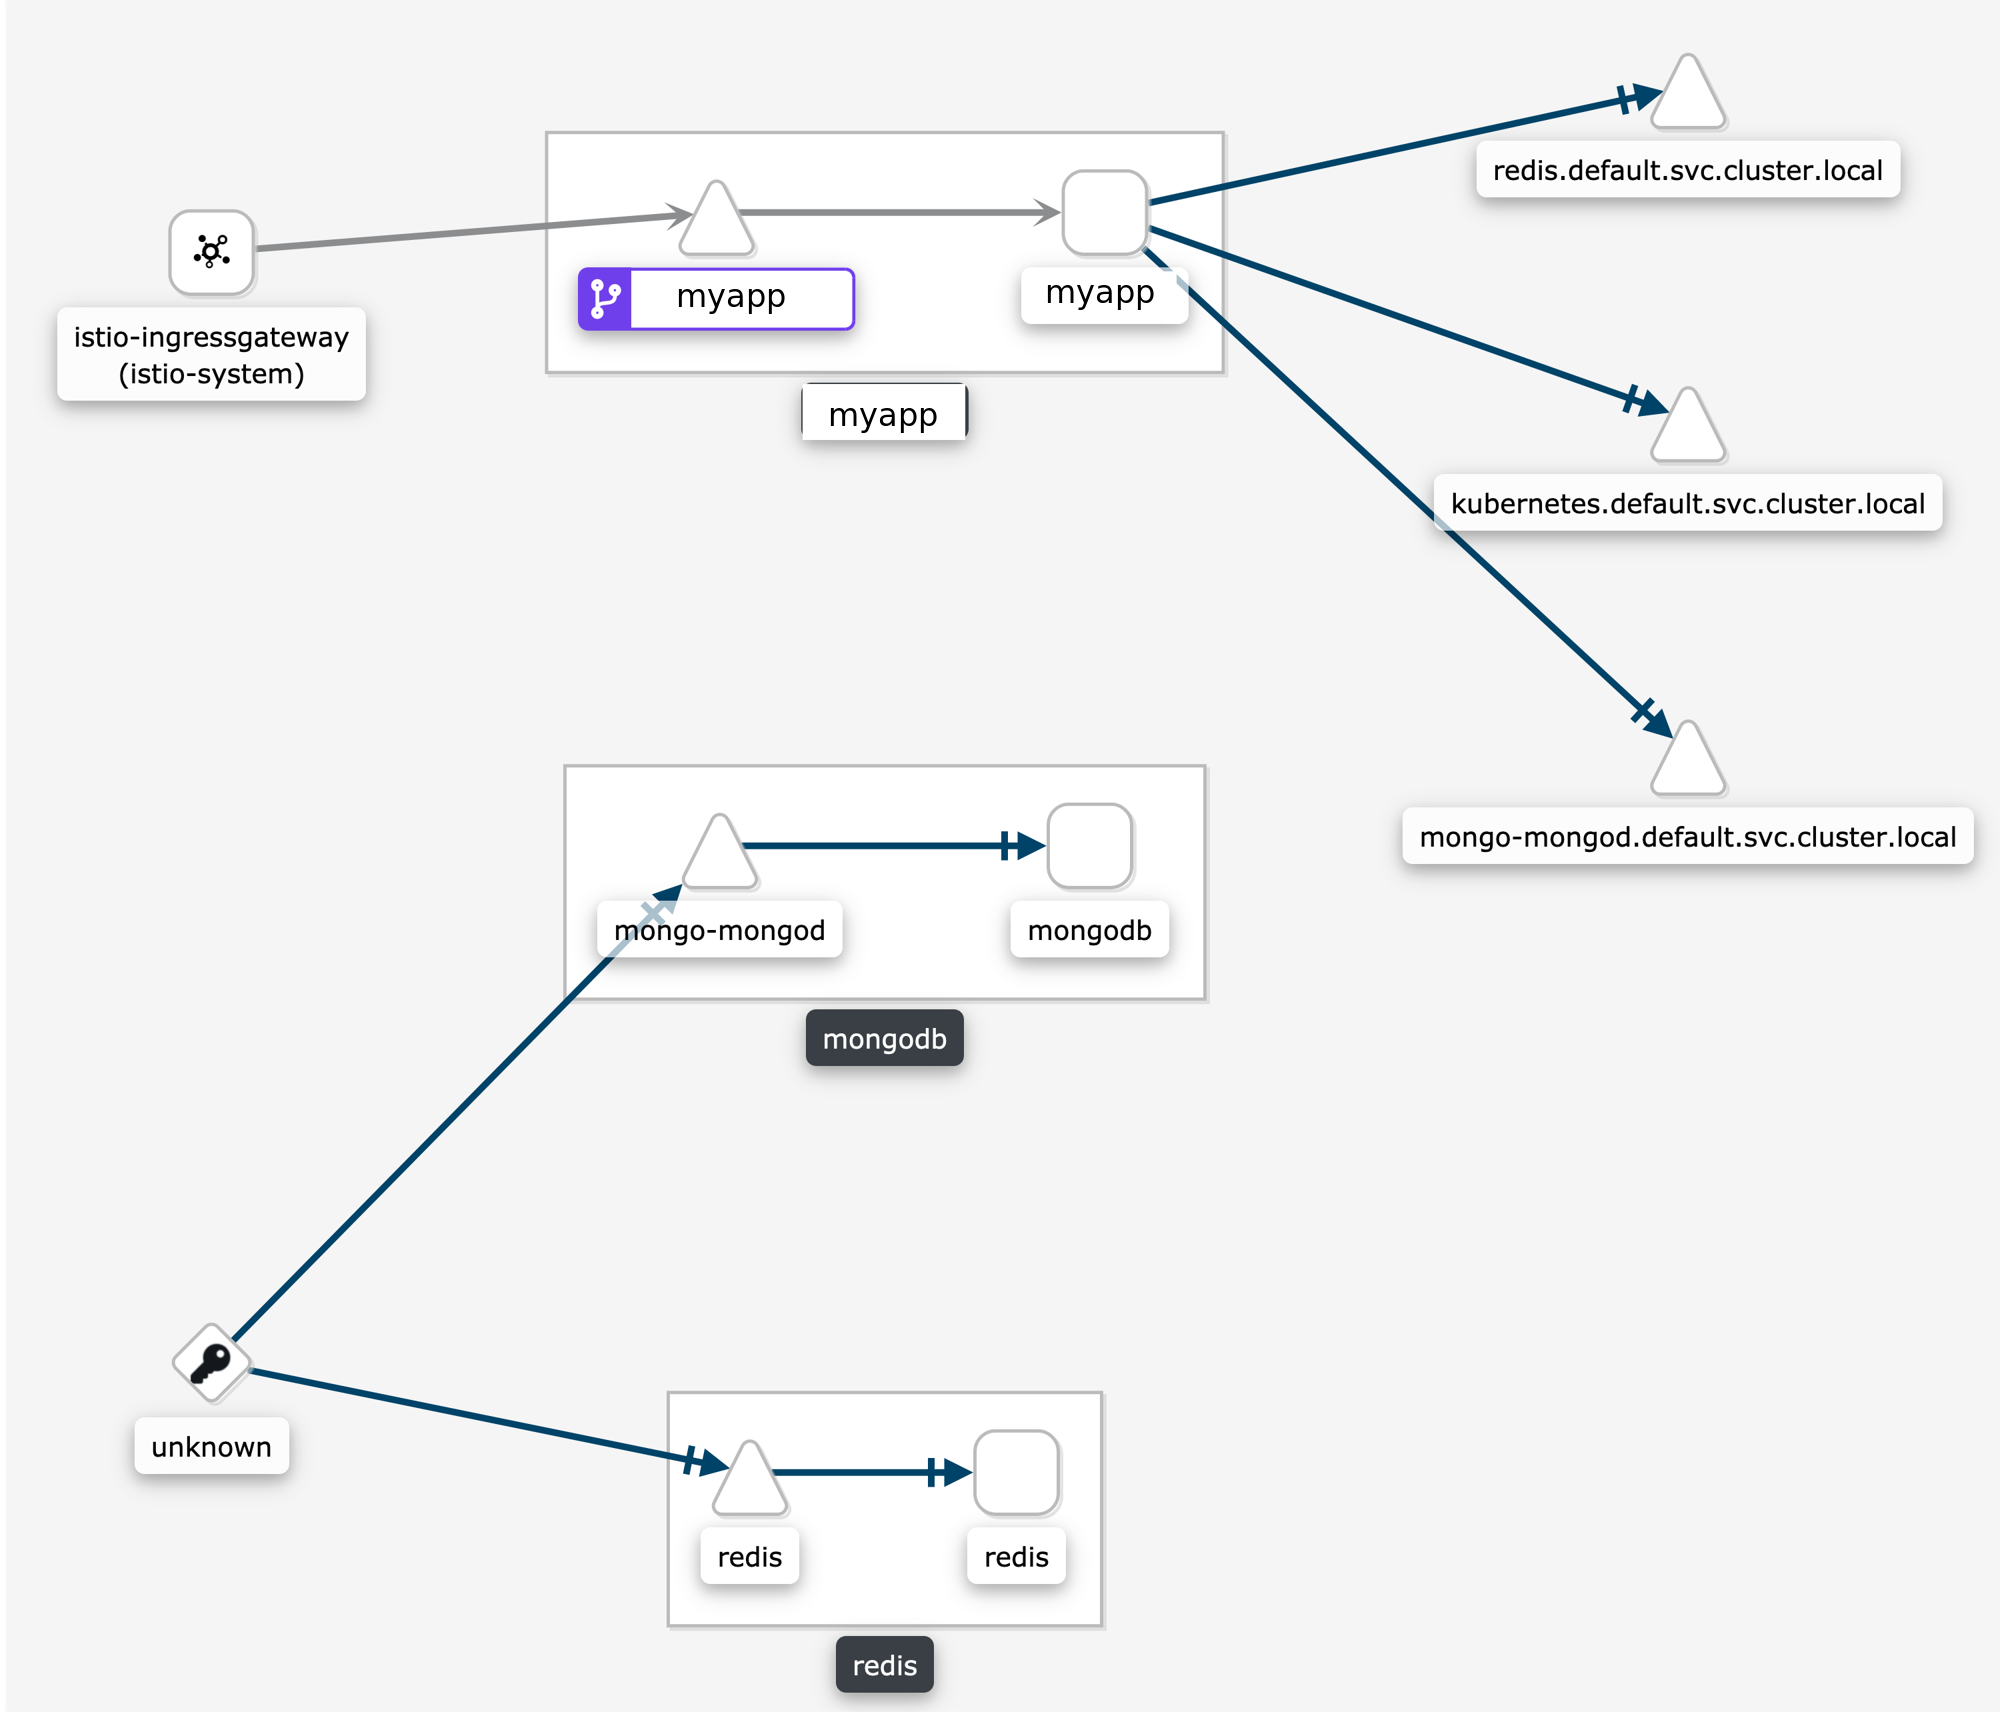
Some users are surprised when requests are not connected in the graph. This is normal Istio telemetry for TCP requests if mTLS is not enabled. For HTTP requests, the requests will be connected even without MTLS, because Istio uses headers to exchange workload metadata between source and destination. With the disconnected telemetry you will see an edge from a workload to a terminal service node. That’s the first hop. And then another edge from “Unknown” to the expected destination service/workload. In the graph below, this can be seen for the requests from myapp to redis and mongodb:
Why my external HTTPS traffic is showing as TCP?
Istio can’t recognize HTTPS request that go directly to the service, the reason is that these requests are encrypted and are recognized as TCP traffic.
You can however configure your mesh to use TLS origination for your egress traffic. This will allow to see your traffic as HTTP instead of TCP.
Why is the graph badly laid out?
The layout for Kiali Graph may render differently, depending on the data to display (number of graph nodes and their interactions) and it’s sometimes difficult, not to say impossible, to have a single layout that renders nicely in every situation. That’s why Kiali offers a choice of several layout algorithms. However, we may still find some scenarios where none of the proposed algorithms offer a satisfying display. If Kiali doesn’t render your graph layout in a satisfactory manner please switch to another layout option. This can be done from the Graph Toolbar located on the bottom left of the graph.
If Kiali doesn’t produce a good graph for you, don’t hesitate to open an issue in GitHub or reach out via the usual channels.
Why are there many unknown nodes in the graph?
In some situations you can see a lot of connections from an “Unknown” node to your services in the graph, because some software external to your mesh might be periodically pinging or fetching data. This is typically the case when you setup Kubernetes liveness probes, or have some application metrics pushed or exposed to a monitoring system such as Prometheus. Perhaps you wouldn’t like to see these connections because they make the graph harder to read.
From the Graph page, you can filter them out by typing node = unknown in the Graph Hide input box.

For a more definitive solution, you could have these endpoints (like /health or /metrics) exposed on a different port and server than your main application, and to not declare this port in your Pod’s container definition as containerPort. This way, the requests will be completely ignored by the Istio proxy, as mentioned in Istio documentation (at the bottom of that page).
Why do I have missing edges?
Kiali builds the graph from Istio’s telemetry. If you don’t see what you expect it probably means that it has not been reported in Prometheus. This usually means that:
1- The requests are not actually sent.
2- Sidecars are missing.
3- Requests are leaving the mesh and are not configured for telemetry.
For example, If you don’t see traffic going from node A to node B, but you are sure there is traffic, the first thing you should be doing is checking the telemetry by querying the metrics, for example, if you know that MyWorkload-v1 is sending requests to ServiceA try looking for metrics of the type:
istio_requests_total{destination_service="ServiceA"}
If telemetry is missing then it may be better to take it up with Istio.
Which lock icons should I see when I enable the Kiali Graph Security Display option?
Sometimes the Kiali Graph Security Display option causes confusion. The option is disabled by default for optimal performance, but enabling the option typically adds nominal time to the graph rendering. When enabled, Kiali will determine the percentage of mutual TLS (mTLS) traffic on each edge. Kiali will only show lock icons on edges with traffic for edges that have > 0% mTLS traffic.
Kiali determines the mTLS percentage for the edges via the connection_security_policy attribute in the
Prometheus telemetry. Note that this is destination telemetry (i.e. reporter="destination").
Why can’t I see traffic leaving the mesh?
See Why do I have missing edges?, and additionally consider whether you need to create a ServiceEntry (or several) to allow the requests to be mapped correctly.
You can check this article on how to visualize your external traffic in Kiali for more information.
Why do I see traffic to PassthroughCluster?
Requests going to PassthroughCluster (or BlackHoleCluster) are requests that did not get routed to a defined service or service entry, and instead end up at one of these built-in Istio request handlers. See Monitoring Blocked and Passthrough External Service Traffic for more information.
Unexpected routing to these nodes does not indicate a Kiali problem, you’re seeing the actual routing being performed by Istio. In general it is due to a misconfiguration and/or missing Istio sidecar. Less often but possible is an actual issue with the mesh, like a sync issue or evicted pod.
Use Kiali’s Workloads list view to ensure sidecars are not missing. Use Kiali’s Istio Config list view to look for any config validation errors.
How do I inspect the underlying metrics used to generate the Kiali Graph?
It is not uncommon for the Kiali graph to show traffic that surprises the user. Often the thought is that Kiali may have a bug. But in general Kiali is just visualizing the metrics generated by Istio. The next thought is that the Istio telemetry generation may have a bug. But in general Istio is generating the expected metrics given the defined configuration for the application.
To determine whether there is an actual bug it can be useful to look directly at the metrics collected by and stored in the Prometheus database. Prometheus provides a basic console that can be opened using the istioctl dashboard command:
> istioctl dashboard prometheus
The above command, assuming Istio and Prometheus are in the default istio-system namespace, should open the Prometheus console in your browser.
Kiali uses a variety of metrics but the primary request traffic metrics for graph generation are these:
- istio_requests_total
- istio_tcp_sent_bytes_total
The Prometheus query language is very rich but a few basic queries is often enough to gather time-series of interest.
Here is a query that returns time-series for HTTP or GRPC requests to the reviews service in Istio’s BookInfo sample demo:
istio_requests_total{reporter="source", destination_service_name="reviews"}
And here is an example of the results:
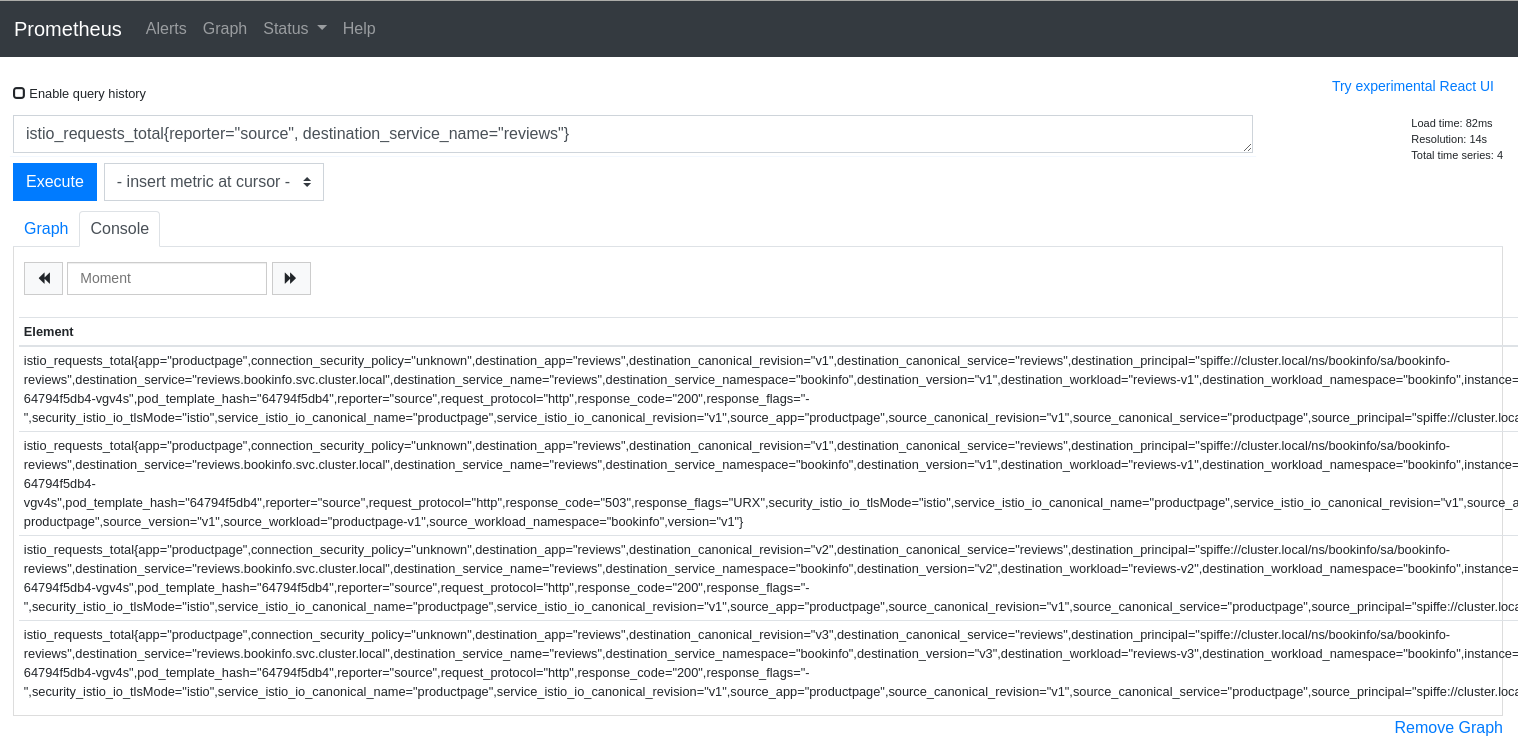
The query above is good for dumping all of the attributes but it can be useful to aggregate results by desired attributes. The next query will get the request counts for the reviews service broken down by source and destination workloads:
sum(istio_requests_total{reporter="source", destination_service_name="reviews"}) by (source_workload, destination_workload)
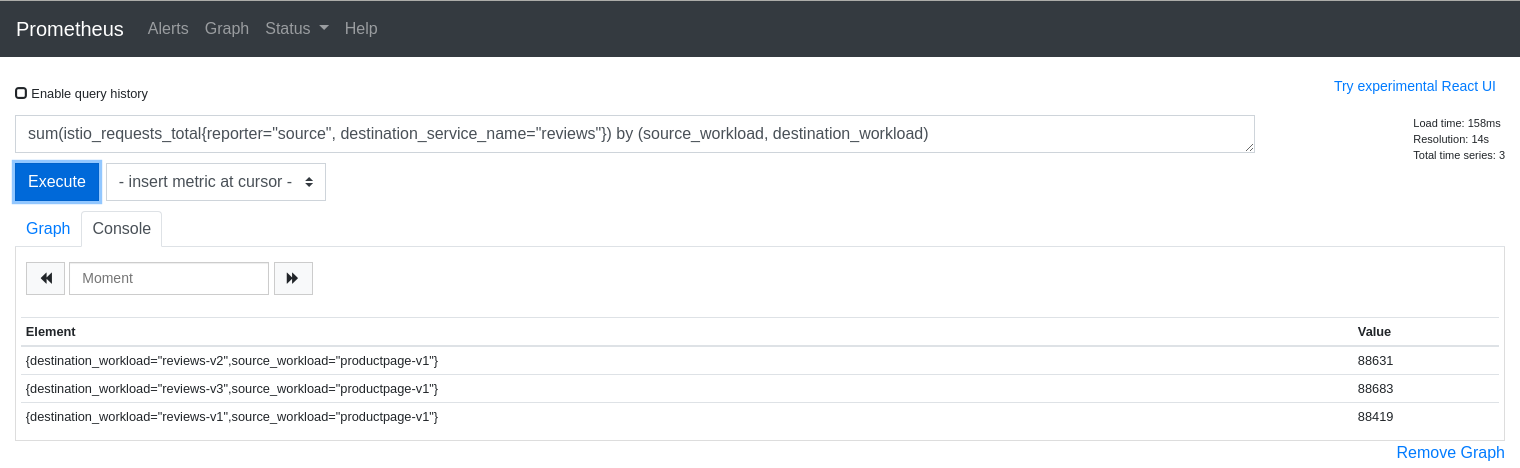
The first step to explaining your Kiali graph is to inspect the metrics used to generate the graph. Kiali devs may ask for this info when working with you to solve a problem, so it is useful to know how to get to the Prometheus console.
Why don’t I see response times on my service graph?
Users can select Response Time to label their edges with 95th percentile response times. The response time indicates the amount of time it took for the destination workload to handle the request. In the Kiali graph the edges leading to service nodes represent the request itself, in other words, the routing. Kiali can show the request rate for a service but response time is not applicable to be shown on the incoming edge. Only edges to app, workload, or service entry nodes show response time because only those nodes represent the actual work done to handle the request. This is why a Service graph will typically not show any response time information, even when the Response Time option is selected.
Because Service graphs can show Service Entry nodes the Response Time option is still a valid choice. Edges to Service Entry nodes represent externally handled requests, which do report the response time for the external handling.
Why does my workload graph show service nodes?
Even when Display Service Nodes is disabled a workload graph can show service nodes. Display Service Nodes ensures that you will see the service nodes between two other nodes,
providing an edge to the destination service node, and a subsequent edge to the node handling the request. This option injects service nodes where they previously would not be
shown. But Kiali will always show a terminal service node when the request itself fails to be routed to a destination workload. This ensures the graph visualizes problem areas.
This can happen in a workload or app graph. Of course in a service graph the Display Service Nodes option is simply ignored.
5 - Installation
Operator fails due to cannot list resource "clusterroles" error
When the Kiali Operator installs a Kiali Server, the Operator will assign the Kiali Server the proper roles/rolebindings so the Kiali Server can access the appropriate namespaces.
The Kiali Operator will check to see if the Kiali CR setting deployment.accessible_namespaces has a value of ['**']. If it does, this means the Kiali Server is to
be given access to all namespaces in the cluster, including namespaces that will be created in the future. In this case, the Kiali Operator will create and assign
ClusterRole/ClusterRoleBinding resources to the Kiali Server. But in order to do this, the Kiali Operator must itself be given permission to create those ClusterRole
and ClusterRoleBinding resources. When you install the Kiali Operator via OLM, these permissions are automatically granted. However, if you installed the Kiali Operator
with the Operator Helm Chart, and if you did so with the value clusterRoleCreator
set to false then the Kiali Operator will not be given permission to create cluster roles. In this case, you will be unable to install a Kiali Server if your Kiali
CR has deployment.accessible_namespaces set to ['**'] - you will get an error similar to this:
Failed to list rbac.authorization.k8s.io/v1, Kind=ClusterRole:
clusterroles.rbac.authorization.k8s.io is forbidden:
User "system:serviceaccount:kiali-operator:kiali-operator"
cannot list resource "clusterroles" in API group
"rbac.authorization.k8s.io" at the cluster scope
Thus, if you do not give the Kiali Operator the permission to create cluster roles, you must tell the Operator which specific namespaces the Kiali Server can
access (you cannot use [**']). When specific namespaces are specified in deployment.accessible_namespaces, the Kiali Operator will create Role
and RoleBindings (not the “Cluster” kinds) and assign them to the Kiali Server.
What values can be set in the Kiali CR?
A Kiali CR is used to tell the Kiali Operator how and where to install a Kiali Server in your cluster. You can install one or more Kiali Servers by creating one Kiali CR for each Kiali Server you want the Operator to install and manage. Deleting a Kiali CR will uninstall its associted Kiali Server.
Most options are described in the pages of the Installation and Configuration sections of the documentation.
If you cannot find some configuration, check the template of the Kiali CR available in Kiali’s GitHub repository, which briefly describes all available options. If you are using a specific version of the Operator, the Kiali CR that is valid for that version can be found in the version tag within the github repository (e.g. Operator v1.25.0 supported these Kiali CR settings).
Note that that Kiali CR template is formatted in such a way that if you uncomment a line (by deleting the line’s leading # character), that line’s setting
will be at the appropriate indentation level. This allows you to create an initial Kiali CR by simply uncommenting lines of the settings you want to define.
The comments are also specifically laid out in such a way that each major top-level group of settings are in their own major comment section, and each value
in each commented setting is the default value (so if you do not define that setting yourself, you will know what its default value is).
How to configure some operator features at runtime
Once the Kiali Operator is installed, you can change some of its configuration at runtime in order to utilize certain features that the Kiali Operator provides. These features are configured via environment variables defined in the operator’s deployment.
Perform the following steps to configure these features in the Kiali Operator:
- Determine the namespace where your operator is located and store that namespace name in
$OPERATOR_NAMESPACE. If you installed the operator via helm, it may bekiali-operator. If you installed the operator via OLM, it may beopenshift-operators. If you are not sure, you can perform a query to find it:
OPERATOR_NAMESPACE="$(kubectl get deployments --all-namespaces | grep kiali-operator | cut -d ' ' -f 1)"
- Determine the name of the environment variable you need to change in order to configure the feature you are interested in. Here is a list of currently supported environment variables you can set:
ALLOW_AD_HOC_KIALI_NAMESPACE: must betrueorfalse. Iftrue, the operator will be allowed to install the Kiali Server in any namespace, regardless of which namespace the Kiali CR is created. Iffalse, the operator will only install the Kiali Server in the same namespace where the Kiali CR is created - any attempt to do otherwise will cause the operator to abort the Kiali Server installation.ALLOW_AD_HOC_KIALI_IMAGE: must betrueorfalse. Iftrue, the operator will be allowed to install the Kiali Server with a custom container image as defined in the Kiali CR’sspec.deployment.image_nameand/orspec.deployment.image_version. Iffalse, the operator will only install the Kiali Server with the default image. If a Kiali CR is created withspec.deployment.image_nameorspec.deployment.image_versiondefined, the operator will abort the Kiali Server installation.ANSIBLE_DEBUG_LOGS: must betrueorfalse. Whentrue, turns on debug logging within the Operator SDK. For details, see the docs here.ANSIBLE_VERBOSITY_KIALI_KIALI_IO: Controls how verbose the operator logs are - the higher the value the more output is logged. For details, see the docs here.ANSIBLE_CONFIG: must be/etc/ansible/ansible.cfgor/opt/ansible/ansible-profiler.cfg. If set to/opt/ansible/ansible-profiler.cfga profiler report will be dumped in the operator logs after each reconciliation run.
- Store the name of the environment variable you want to change in
$ENV_NAME:
ENV_NAME="ANSIBLE_CONFIG"
- Store the new value of the environment variable in
$ENV_VALUE:
ENV_VALUE="/opt/ansible/ansible-profiler.cfg"
- The final step depends on how you installed the Kiali Operator:
oc. If you are using a non-OpenShift Kubernetes environment, simply substitute all the oc references to kubectl.
- If you installed the operator via helm, simply set the environment variable on the operator deployment directly:
oc -n ${OPERATOR_NAMESPACE} set env deploy/kiali-operator "${ENV_NAME}=${ENV_VALUE}"
- If you installed the operator via OLM, you must set this environment variable within the operator’s CSV and let OLM propagate the new environment variable value down to the operator deployment:
oc -n ${OPERATOR_NAMESPACE} patch $(oc -n ${OPERATOR_NAMESPACE} get csv -o name | grep kiali) --type=json -p "[{'op':'replace','path':"/spec/install/spec/deployments/0/spec/template/spec/containers/0/env/$(oc -n ${OPERATOR_NAMESPACE} get $(oc -n ${OPERATOR_NAMESPACE} get csv -o name | grep kiali) -o jsonpath='{.spec.install.spec.deployments[0].spec.template.spec.containers[0].env[*].name}' | tr ' ' '\n' | cat --number | grep ${ENV_NAME} | cut -f 1 | xargs echo -n | cat - <(echo "-1") | bc)/value",'value':"\"${ENV_VALUE}\""}]"
How can I inject an Istio sidecar in the Kiali pod?
By default, Kiali will not have an Istio sidecar. If you wish to deploy the Kiali pod with a sidecar,
you have to define the sidecar.istio.io/inject=true label in the spec.deployment.pod_labels setting in the Kiali CR. For example:
spec:
  deployment:
    pod_labels:
      sidecar.istio.io/inject: "true"
If you are utilizing CNI in your Istio environment (for example, on OpenShift), Istio will not allow sidecars to work when injected in pods deployed in the control plane namespace, e.g. istio-system. (1) (2) (3). In this case, you must deploy Kiali in its own separate namespace. On OpenShift, you can do this using the following instructions.
Determine what namespace you want to install Kiali and create it. Give the proper permissions to Kiali. Create the necessary NetworkAttachmentDefinition. Finally, create the Kiali CR that will tell the operator to install Kiali in this new namespace, making sure to add the proper sidecar injection label as explained earlier.
NAMESPACE="kialins"

oc create namespace ${NAMESPACE}

oc adm policy add-scc-to-group privileged system:serviceaccounts:${NAMESPACE}

cat <<EOM | oc apply -f -
apiVersion: k8s.cni.cncf.io/v1
kind: NetworkAttachmentDefinition
metadata:
  name: istio-cni
  namespace: ${NAMESPACE}
EOM

cat <<EOM | oc apply -f -
apiVersion: kiali.io/v1alpha1
kind: Kiali
metadata:
  name: kiali
  namespace: ${NAMESPACE}
spec:
  istio_namespace: istio-system
  auth:
    strategy: anonymous
  deployment:
    accessible_namespaces: [ '**' ]
    pod_labels:
      sidecar.istio.io/inject: "true"
EOM
After the operator installs Kiali, confirm you have two containers in your pod. This indicates your Kiali pod has its proxy sidecar successfully injected.
$ oc get pods -n ${NAMESPACE}
NAME                    READY   STATUS    RESTARTS   AGE
kiali-56bbfd644-nkhlw   2/2     Running   0          43s
6 - Istio Component Status
How can I add one component to the list?
If you are interested in adding one more component to the Istio Component Status tooltip, you have the option to add one new component into the
Kiali CR, under the external_services.istio.component_status field.
For each component there, you will need to specify the app label of the deployment’s pods, the namespace and whether is a core component or add-on.
One component is ‘Not found’ but I can see it running. What can I do?
The first thing you should do is check into the Kiali CR for the istio.component_status field.
Kiali looks for a Deployment for which its pods have the app label with the specified value in the CR, and lives in that namespace.
The app label name may be changed from the default (app) and it is specified in the istio_labels.app_label_name in the Kiali CR.
Ensure that you have specified correctly the namespace and that the deployment’s pod template has the specified label.
One component is ‘Unreachable’ but I can see it running. What can I do?
Kiali considers one component as Unreachable when the component responds to a GET request with a 4xx or 5xx response code.
The URL where Kiali sends a GET request to is the same as it is used for the component consumption. However, Kiali allows you to set a specific URL for health check purposes: the health_check_url setting.
In this example, Kiali uses the Prometheus url for both metrics consumption and health checks.
external_services:
  prometheus:
    url: "http://prometheus.istio-system:9090"
In case that the prometheus.url endpoint doesn’t return 2XX/3XX to GET requests, you can use the following settings to specify which health check URL Kiali should use:
external_services:
  prometheus:
    health_check_url: "http://prometheus.istio-system:9090/healthz"
    url: "http://prometheus.istio-system:9090"
Please check the Kiali CR for more information. Each external service component has its own health_check_url and is_core setting to tailor the experience in the Istio Component Status feature.
7 - Validations
Which formats does Kiali support for specifying hosts?
Istio highly recommends that you always use fully qualified domain names (FQDN) for hosts in DestinationRules. However, Istio does allow you to use other formats like short names (details or details.bookinfo). Kiali only supports FQDN and simple service names as host formats: for example details.bookinfo.svc.cluster.local or details. Validations using the details.bookinfo format might not be accurate.
In the following example it should show the validation of “More than one Destination Rule for the same host subset combination”. Because of the usage of the short name reviews.bookinfo Kiali won’t show the warning message on both destination rules.
apiVersion: networking.istio.io/v1alpha3
kind: DestinationRule
metadata:
  name: reviews-dr1
spec:
  host: reviews
  trafficPolicy:
    loadBalancer:
      simple: RANDOM
  subsets:
  - name: v1
    labels:
      version: v1
  - name: v2
    labels:
      version: v2
  - name: v3
    labels:
      version: v3
---
apiVersion: networking.istio.io/v1alpha3
kind: DestinationRule
metadata:
  name: reviews-dr2
spec:
  host: reviews
  trafficPolicy:
    loadBalancer:
      simple: RANDOM
  subsets:
  - name: v1
    labels:
      version: v1
See the recomendation Istio gives regarding host format: “To avoid potential misconfigurations, it is recommended to always use fully qualified domain names over short names."
For best results with Kiali, you should use fully qualified domain names when specifying hosts.